Key points
- The global clean power pipeline surged in 2025. Announced and in-progress wind and utility-scale solar projects expanded by 11%, increasing from 4.4 terawatts (TW) to almost 5 TW worldwide.
- Globally, utility-scale solar led the expansion of the pipeline. The utility-scale solar pipeline grew by 17% and passed 2.2 TW, while the wind pipeline grew by 7%.
- The world’s richest economies are not driving that growth. The G7 countries, despite controlling roughly half of global wealth, account for 11% of the world’s prospective wind and utility-scale solar capacity additions. The center of gravity for new clean power has shifted decisively toward emerging and developing economies.
- China crossed a historic threshold. Its combined operating wind, utility-scale solar, and distributed solar capacity surpassed 1.6 TW in 2025, triple the combined capacity of its closest peers, the United States and India.
- Distributed solar is a pillar of the clean energy transition, but it’s not evenly spread. While it represents about 42% of all existing and prospective solar capacity worldwide, deployment remains heavily concentrated in a small number of countries, leaving significant room to expand.
Prospective wind and utility-scale solar pipeline reached almost 5 TW in 2025
In 2025, the global total capacity of planned wind and utility-scale solar projects grew by 11%, from 4.4 terawatts (TW) to 4.9 TW, according to new data from Global Energy Monitor (GEM)1. This marks a significant milestone toward achieving global targets to triple renewable energy capacity, since wind and solar are expected to comprise 94% of renewable additions towards the tripling goal.
Within the global 4.9 TW pipeline, wind and utility-scale solar account for comparable portions, at 2.7 TW and 2.2 TW, respectively. Globally, 758 gigawatts (GW) of these projects are currently under construction, with three-quarters concentrated in China and India. China hosts more than half of these under-construction wind and utility-scale solar projects, totaling 448 GW. India follows with 125 GW currently under construction, advancing toward its 2030 target of 500 GW non-fossil capacity.
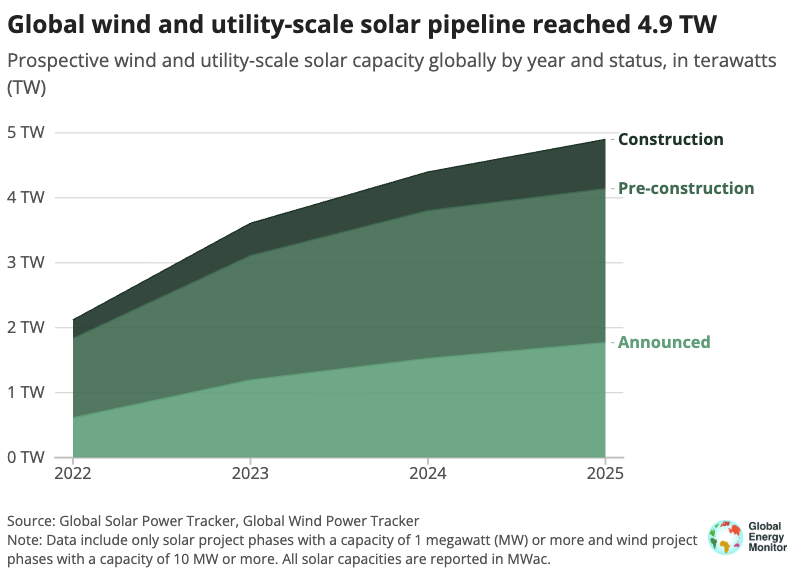
Figure 1
Year-on-year growth in the wind and utility-scale solar pipeline has slowed from 22% in 2024 to 11% in 2025. GEM’s data reveal that this trend is more pronounced for wind projects, with a 13% drop from 2024, compared to a 7% drop for solar projects. In 2025, wind developers experienced political barriers and a streak of failed wind power auctions. Decline in planned wind development could have an outsized impact on future power generation, given wind’s higher capacity factor over solar.
The growth trend of the prospective wind and utility-scale solar pipeline is critical for meeting the COP28 commitment to triple renewable energy capacity by 2030, as the world enters the final five years of the implementation period. The International Renewable Energy Agency (IRENA) estimates that an average annual addition of 317 GW of wind capacity and 735 GW of solar capacity is required by 2030. Utility-scale solar additions must reach 2.2 TW over the next 5 years, assuming this segment accounts for 58% of all solar installations.
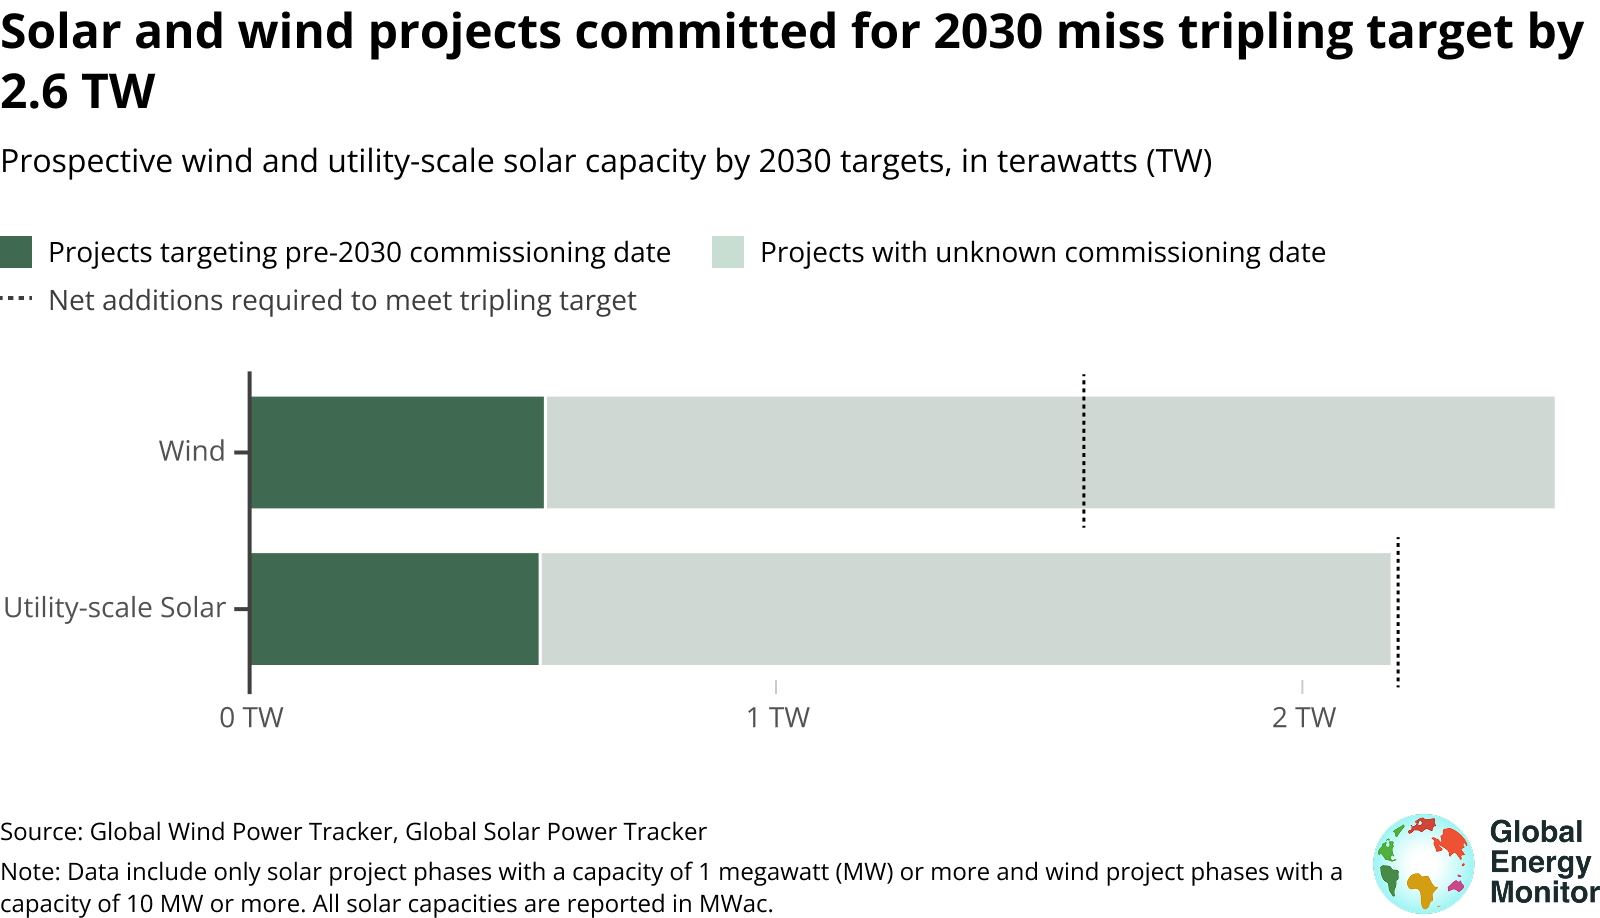
Figure 2
Even if every wind and utility-scale solar project with a planned start year by 2030 came online, the tripling goal would be short by 1 TW of wind and 1.6 TW of utility-scale solar. In addition, GEM’s previous analysis revealed that almost 40% of all planned projects are either late to come online or end up shelved or cancelled. While prospective wind and utility-scale solar projects with unknown commissioning dates could compensate for the deficit, political barriers and implementation disincentives could delay their deployment. Moreover, the slowdown in the growth of the wind and utility-scale pipeline observed in GEM data broadly aligns with projections from the International Energy Agency (IEA) and BloombergNEF, indicating that wind and utility-scale solar growth could plateau through 2030.
The wealthiest nations’ wind and solar pipeline remains unchanged
The clean energy transition is progressing unevenly around the world. China accounts for more than 1.5 TW of prospective wind and utility-scale solar capacity — roughly matching the combined total of the next six countries: Brazil (401 GW), Australia (368 GW), India (234 GW), the United States (226 GW), Spain (165 GW), and the Philippines (146 GW). G7 countries, despite their wealth, fall notably behind China and the rest of the world in year-over-year prospective capacity growth.
Figure 3
The most recent release of the Global Solar Power Tracker and the Global Wind Power Tracker shows that the wind and solar pipeline in China grew from 1.2 TW to 1.5 TW in 2025. Countries outside the G7 and China also achieved a growth from 2.7 TW to 2.9 TW. The G7’s wind and utility-scale solar pipeline remained mostly unchanged at around 520 GW since 2023, despite IRENA’s calls on G7 countries to more than double their annual renewable energy capacity additions through 2030. Over the next five years, the IEA estimates that roughly 70% of all renewable additions in G7 countries are projected to come from wind and utility-scale solar — emphasizing the misalignment between current pipelines and required progress.
China has passed 1.6 TW of operating wind and solar projects
China leads globally in combined wind and total solar capacity, with at least 1.6 TW in operation, based on data through December 2025, including 489 GW of distributed solar. The United States follows, having surpassed 368 GW of operating wind and solar capacity. In 2025, the U.S. added 4.9 GW of wind, 25.6 GW of utility-scale solar, and 5.5 GW of distributed solar. India ranks third globally, with more than 163 GW of operating wind and solar capacity.
Figure 4
Distributed solar plays a significant role in the clean energy transition. In addition to monitoring utility-scale solar projects at the asset level, GEM’s Global Solar Power Tracker has begun collecting nationally aggregated distributed solar installations2 in select countries. The IEA estimates that approximately 42% of all existing and prospective solar capacity is distributed, highlighting its significant role in meeting tripling targets. Beyond its sizable share, distributed solar can also enhance health, education, and working conditions by providing reliable access to electricity in least developed countries.
Operating distributed solar capacity is concentrated in a few countries
GEM’s Global Solar Power Tracker now reports nearly 900 GW of operating distributed solar3 capacity across 31 countries/areas. Of the reported total, distributed solar capacity is highly concentrated, with the top ten countries representing 90% of the reported distributed solar total. China contributes roughly 489 GW, more than seven times Germany’s 69 GW. Several G7 countries, including Germany, the United States, Italy, Japan, and France, appear among the largest reported totals.
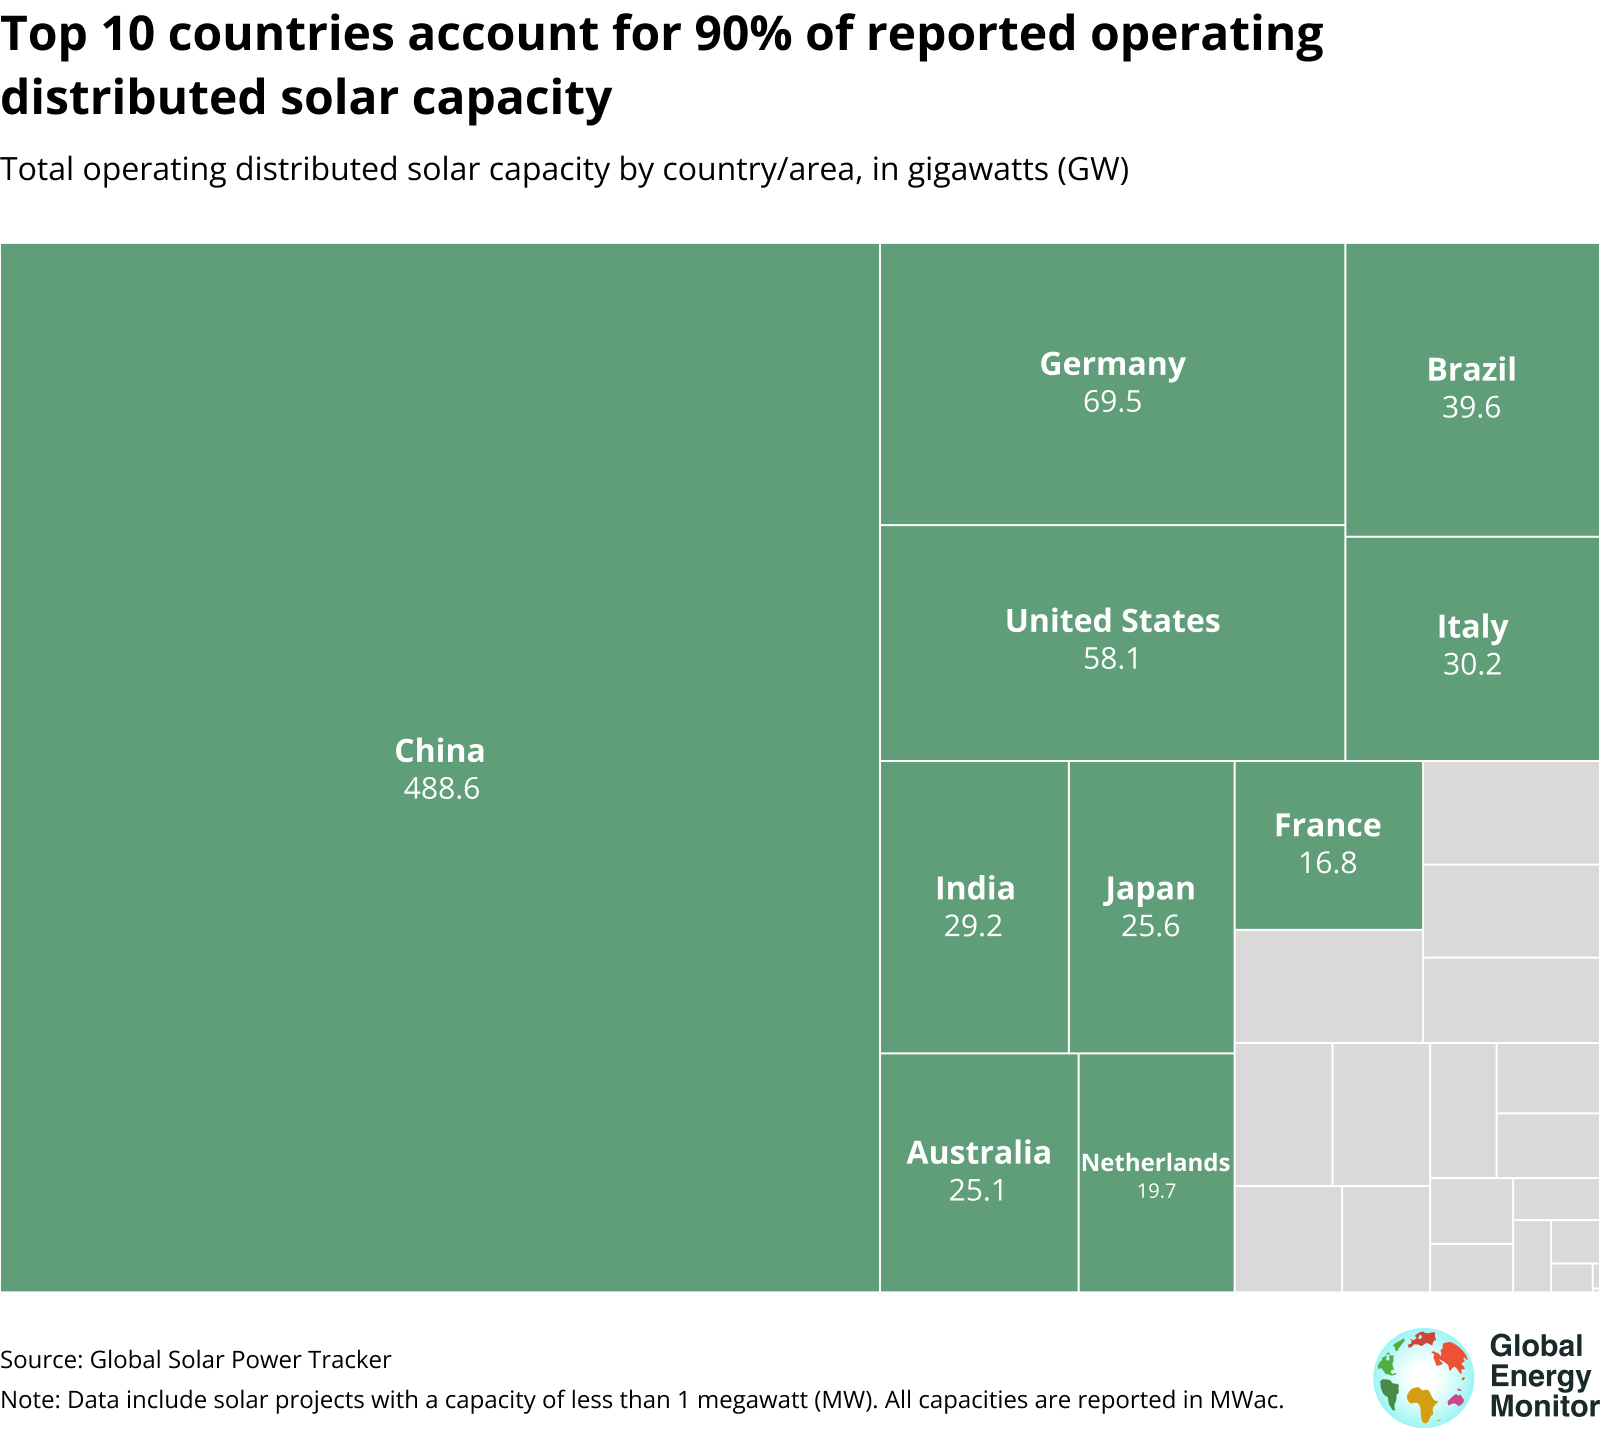
Figure 5
Beyond the top countries, Europe has a broad mid-tier of multi-GW countries, while reported totals across Latin America, Asia, and Africa are more dispersed and generally smaller. Within these regions, Taiwan and South Africa stand out as the largest reported distributed solar total, supported by strong policy incentives (e.g., feed-in tariffs and frameworks for small-scale generation). Overall, GEM’s Global Solar Power Tracker data show that reported distributed solar remains highly concentrated, leaving substantial room for expansion.
Given the large role of distributed solar in recent growth, progress toward the 2030 tripling target cannot be assessed from utility-scale solar projects alone. In some G7 countries, distributed systems already represent a larger share of all operating solar, at around 57% in France, 68% in Germany, and 86% in Italy. Since 2020, operating distributed solar has significantly increased in developed countries. This trend can partially be attributed to the growing residential segment and the increasing comparative advantage of small-scale systems in offsetting electricity costs in Europe and the United States.
Figure 6
Globally, distributed solar expanded more than threefold between 2020 and 2024. These findings underscore why utility-scale pipelines alone cannot paint the full picture of solar expansion in the G7 or elsewhere. Echoing earlier results on wind and utility-scale solar, wealthy nations would need to invest in grids and storage to support distributed solar and limit solar curtailment. With only five years remaining, accelerating wind and solar deployment — including distributed solar — is essential to meet the tripling goals set at COP28, and G7 countries have a significant opportunity to pick up the pace.