solar farm phases tracked
gigawatts alternating current of operating capacity
gigawatts alternating current of prospective capacity
countries/areas feature distributed solar
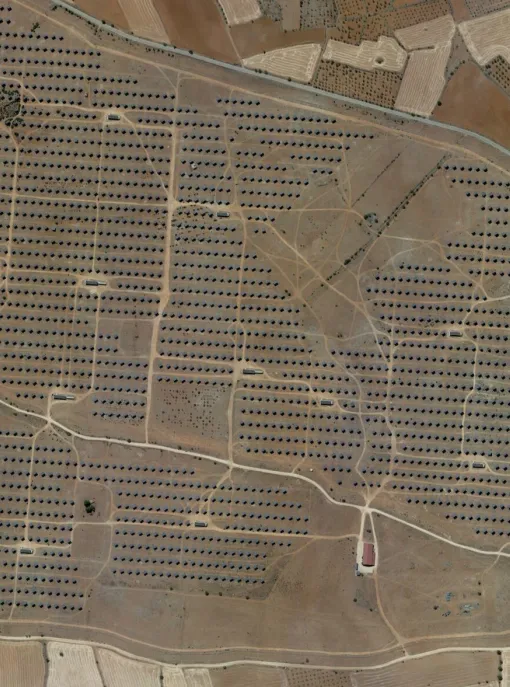
Overview
By breaking down solar into utility-scale and distributed capacity, the Global Solar Power Tracker provides key insights for the just energy transition.
The Global Solar Power Tracker’s utility-scale data (1 megawatt (MW)+) catalog over 100,000 operating and prospective projects worldwide. With over 440 gigawatts of utility-scale solar under construction worldwide, total utility-scale operating capacity will increase by a third within the next few years. Three-quarters of this capacity under construction is confined to just China and India. Nonetheless, even if every planned project with a start year by 2030 managed to come online on time, the global target of tripling renewables by 2030 would be short by nearly 1.6 terawatts. While prospective projects with unknown commissioning dates could compensate for the deficit, political barriers and implementation disincentives could delay their deployment. China is the runaway leader in solar deployment, while the wealthiest nations in the G7 have stagnated.
Solar projects dedicated to green hydrogen production are some of the largest planned solar projects in the world. Many are planned in Africa, where over 50% of all prospective utility-scale solar capacity is earmarked for green hydrogen rather than local electricity generation.
Distributed solar is a pillar of the clean energy transition but is not evenly spread. While it represents about 42% of all existing and prospective solar capacity worldwide, deployment remains heavily concentrated in a small number of countries, leaving significant room to expand. The Global Solar Power Tracker tracks nationally aggregated distributed (<1 MW) solar for 31 countries/areas, with expanded geographical and temporal coverage planned in future data releases. This is the first data source of its kind that is focused on applying a consistent, global definition of distributed solar, using government, utility, or industry sources, along with full transparency in how the numbers are derived.
China has 1,000+ GWac of operating solar, five times that of its closest peer, the United States.
In 2025, global prospective utility-scale solar capacity grew by 17% and exceeded 2.2 TW.
Meet the team
If you have questions about this project, please contact the Project Manager, Kasandra O'Malia.
Get in touch


Related projects
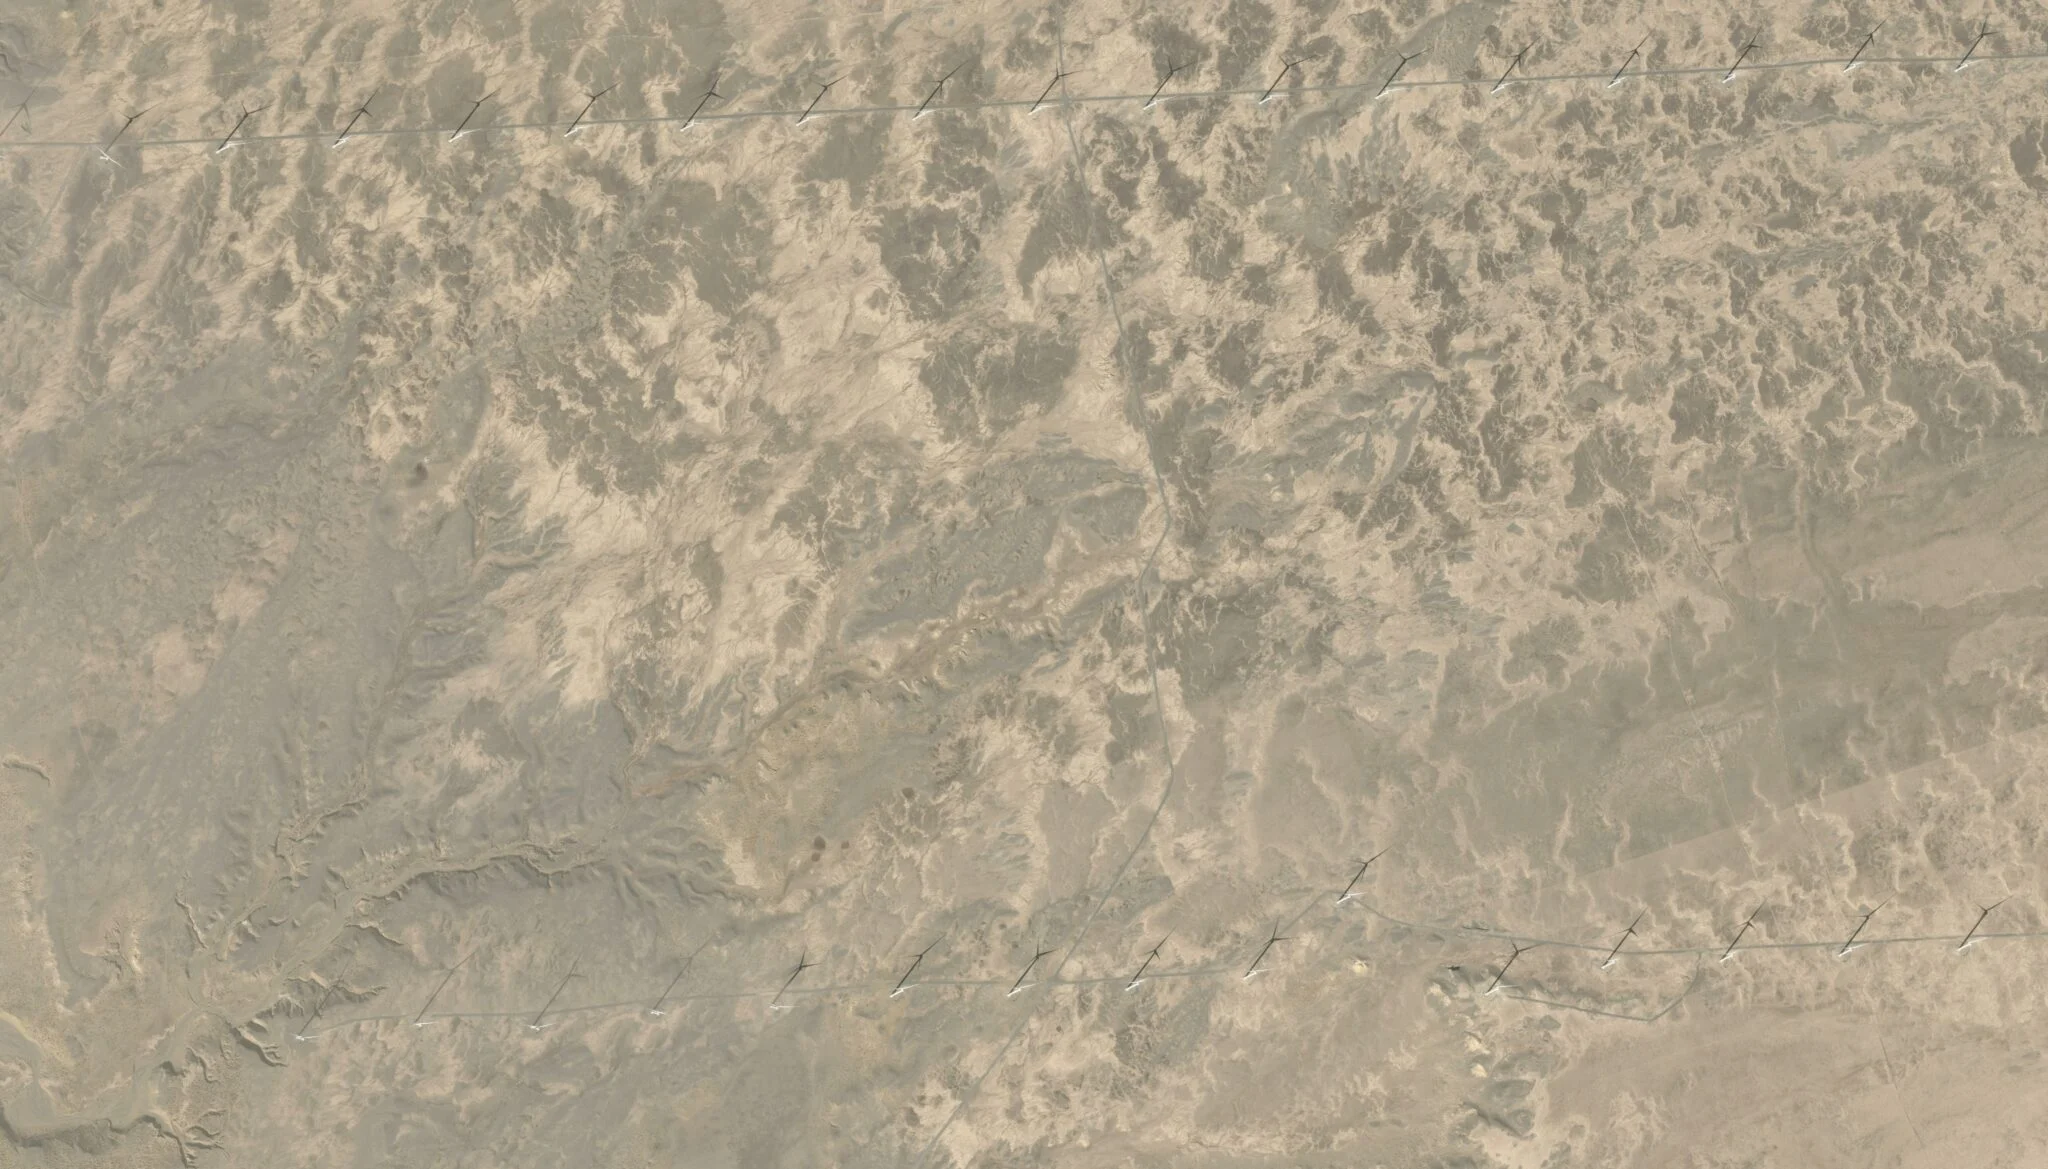
The Global Wind Power Tracker is composed of worldwide facility-level data for utility-scale onshore and offshore wind power facilities (10 MW+).
The Global Geothermal Power Tracker (GGPT) is a worldwide dataset of geothermal power facilities detailing capacity, operational status, technology ty...
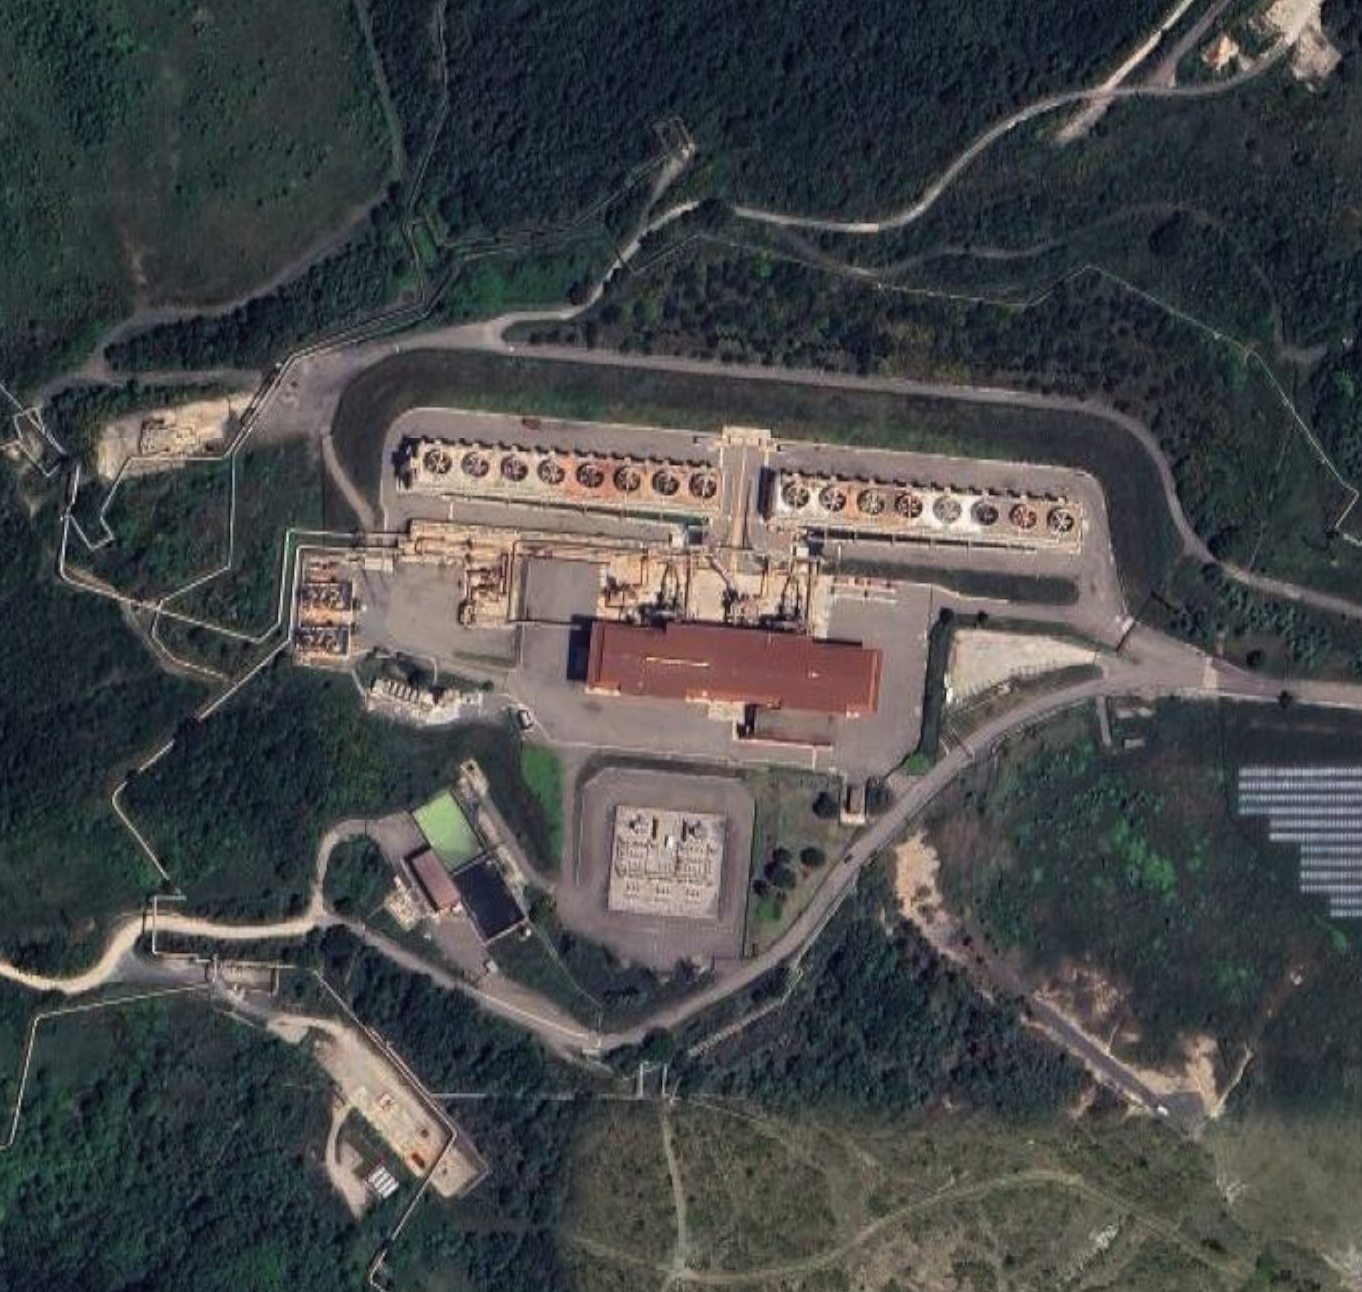
The Global Hydropower Tracker (GHT) is a worldwide dataset of hydroelectric power facilities and includes information such as status, technology type,...
The Global Energy Transition Tracker (GETT) is a hub monitoring iconic zones with the potential to shift systems; inspire global replication; and spar...
Methodology
View the methodology on the GEM.wiki
Frequently Asked Questions
Contact
For questions about the Global Solar Power Tracker, contact Kasandra O’Malia: