Home
Close Tracker Map 

Main navigation

About
About
About GEM

What is a tracker?

People

Careers

Financial information

Contact us

Our impact

Annual reports

Partners

Who uses GEM research

Data in action

Support our work

Subscribe

Give now

Funders and donors

Browse data
Trackers
Oil and gas

Oil and gas plants

Oil and gas extraction

Oil infrastructure

Gas infrastructure

Coal

Coal plants

Coal mines

Coal terminals

Renewables and other power

Solar

Wind

Hydropower

Geothermal

Bioenergy

Nuclear

Heavy industry

Iron and steel

Cement and concrete

Iron ore mines

Chemicals inventory

Finance and corporates

Energy ownership

Private equity

Coal project finance

Gas project finance

Energy transition

Integrated power

Global energy transition

Methane emitters

Latin America energy

GEM.wiki

Insights and updates
Insights
Reports and briefings

Updates
Press releases

In the news

Newsletters
Coal Wire

Inside Gas


Search
Subscribe Download data
Home
Blog
Heavy industry

New data insights: Global Chemicals Tracker

Greatly expanded dataset now includes plant-level capacity for eight building-block chemicals across 97 countries/areas.

By Joe Hittinger
Share on:
   

The 2026 release of the Global Chemicals Tracker (GChT) is live. It now tracks 1,320 plants across 97 countries/areas producing eight building-block chemicals: ammonia, methanol, ethylene, propylene, butadiene, benzene, toluene, and xylene. Together, these plants hold nearly 790 million tonnes per annum (mtpa) of operating capacity, with over 360 mtpa more in development.

The GChT builds on GEM’s Global Chemicals Inventory, which last year covered 868 operating plants in 80 countries/areas. This year’s release adds plant-level capacity data for the first time and follows plants through every stage, from announced projects to retired sites. That gives a much fuller picture of where the industry is headed and a first baseline for measuring its progress on decarbonization.

This year’s update includes:

  • Expanded coverage to 1,320 plants, now including announced, construction, mothballed, retired, and cancelled plants alongside operating ones.
  • Plant-level existing and developing capacity for all eight chemicals, plus planned start dates for new capacity.
  • New data types: plant age and key dates, plant type, main production equipment, parent ownership, and four decarbonization technology fields (CCS/CCUS, electrified process heat, low-carbon hydrogen, and bio- or waste-based feedstock or fuel).
  • A new interactive map and dashboard tool, and summary statistics by country, region, and Chinese province.
Tracker
Global Chemicals Tracker

Open tracker


Subscribe to stay informed about our latest work and updates

Join our mailing list
Download the data set

Trends & insights from the 2026 data

The new capacity data shows where chemical production is growing, how much of that growth has turned to coal, and how little of the pipeline is low-carbon so far:

  • Growth is shifting away from China and Europe: China holds about a third of global operating capacity but only 15% of capacity in development. India, Iran, and China have the largest development pipelines (66, 60, and 56 mtpa), though much of India’s is announced low-carbon ammonia that has yet to break ground. Europe has the oldest fleet of any region, with plants averaging nearly 60 years old, but accounts for just 2% of capacity in development. At least five of its steam crackers have been retired, mothballed, or slated for retirement since 2025.
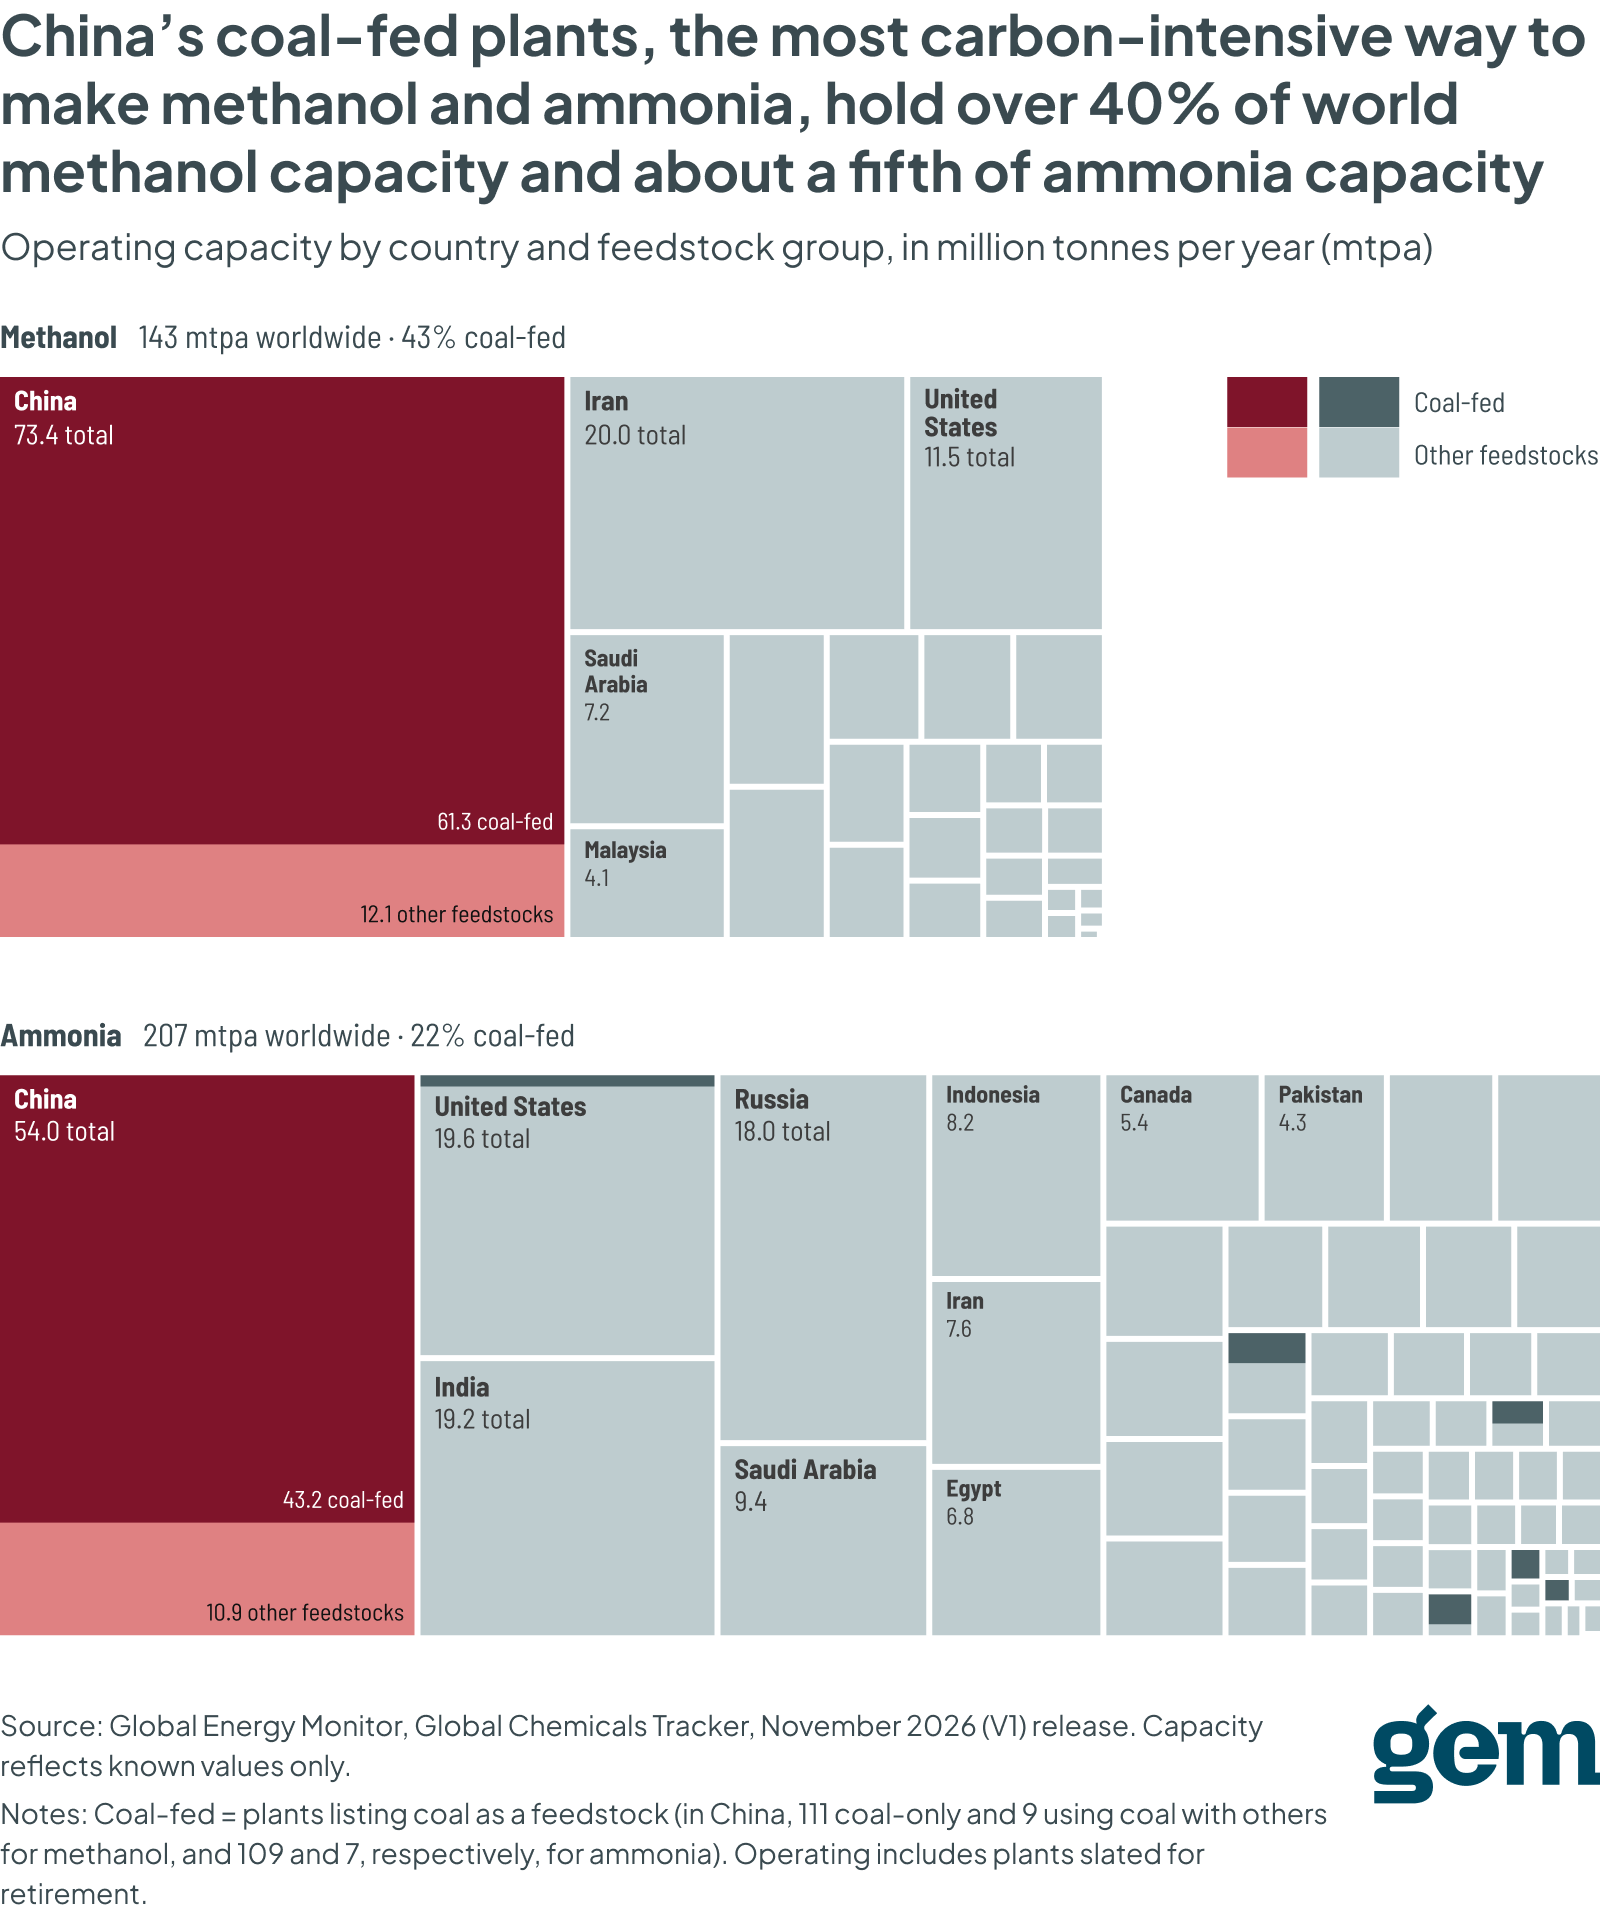
  • Coal has become a pillar of China’s chemical buildout: China’s coal-fed plants alone hold 43% of the world’s operating methanol capacity and about a fifth of its ammonia capacity, more than any other country’s entire industry for either chemical. Most of that capacity has come online since 2010, and coal is set to feed just over half of China’s development pipeline.
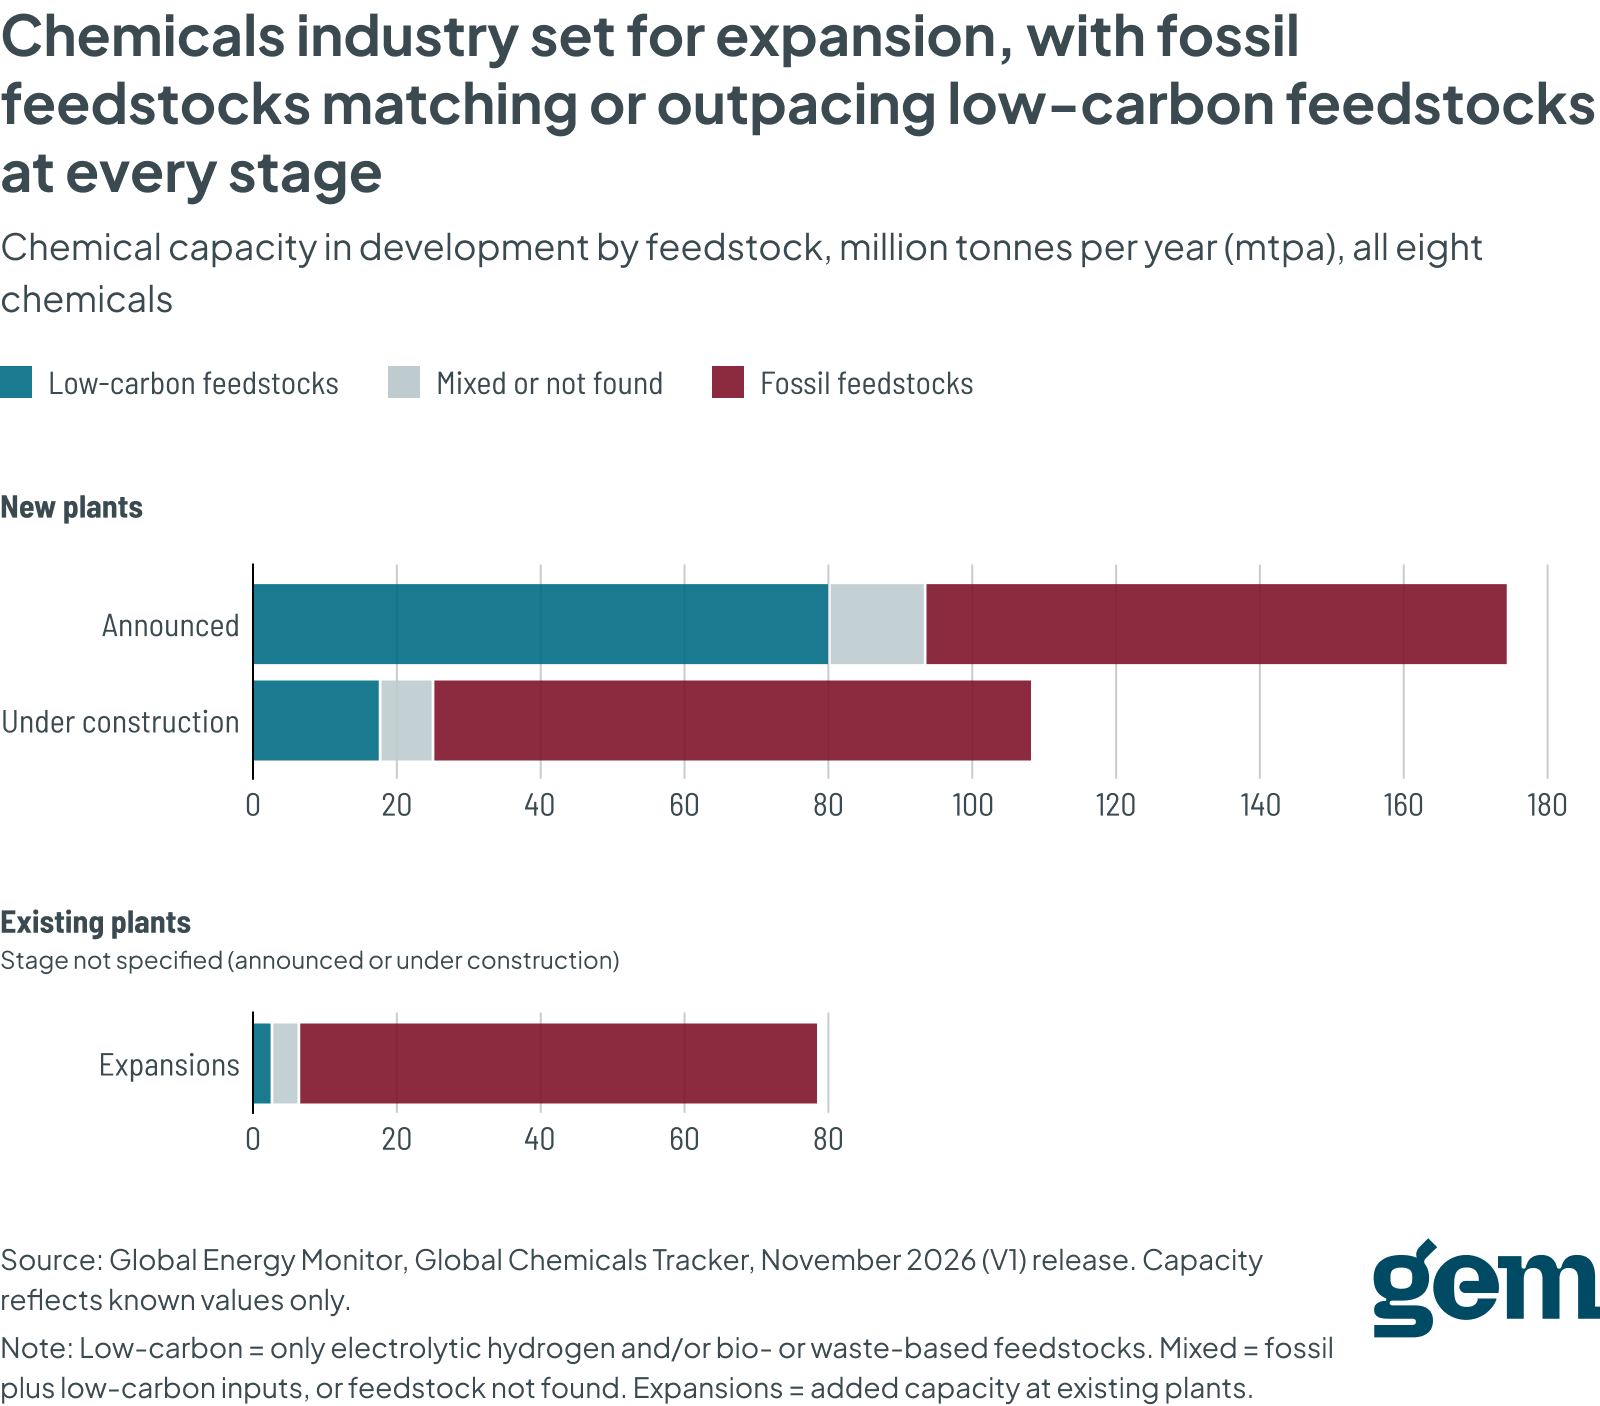
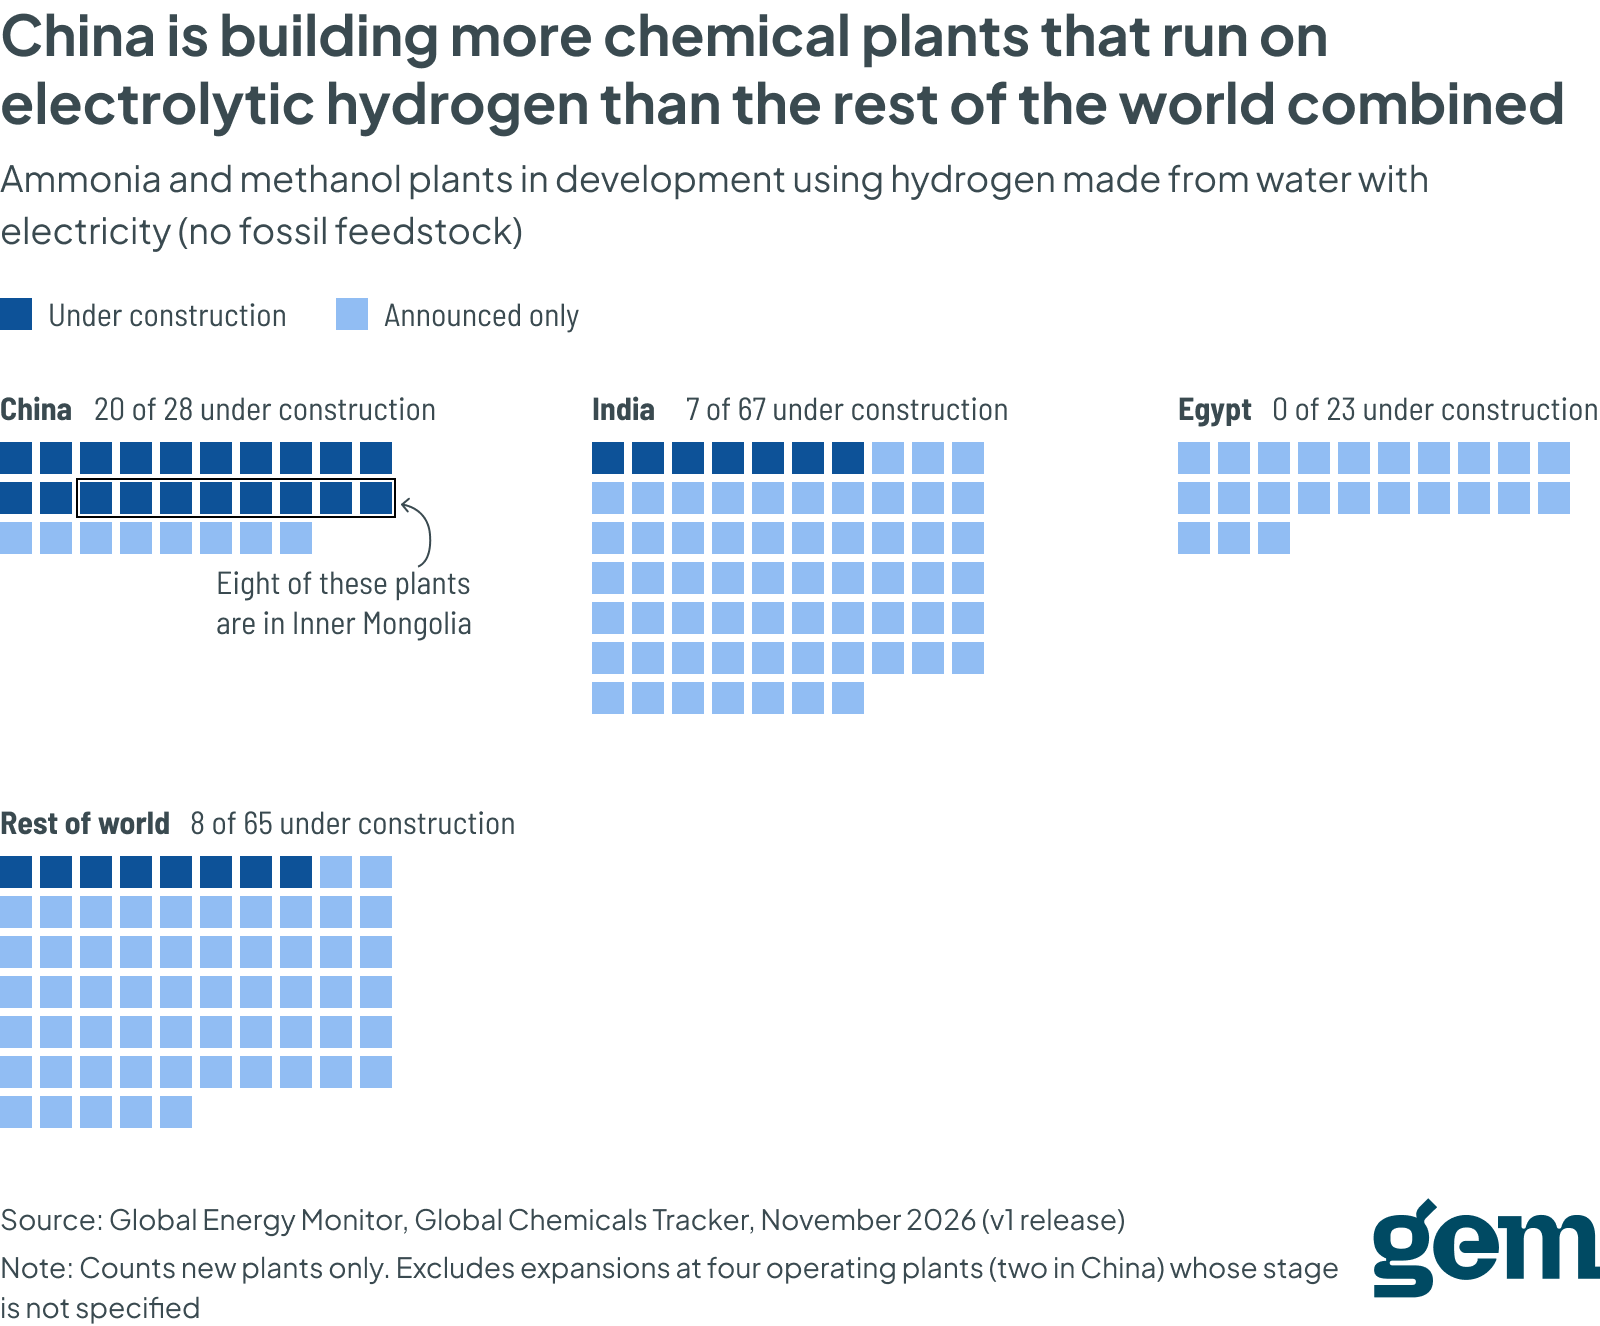
  • Low-carbon production is still mostly on paper: Plants using low-carbon feedstocks make up nearly half of announced capacity, but only about a sixth of what’s actually under construction. Of the 183 plants in development that would run on electrolytic hydrogen, only 35 have broken ground, and 20 of those are in China.


The eight chemicals tracked by the GChT account for roughly two-thirds of the global chemicals industry’s energy demand. Where new capacity gets built, and what it runs on, will shape the sector’s emissions for decades. The GChT will continue to track these changes as they unfold.

Joe Hittinger
Project Manager, Chemicals
View Profile


Explore this data and more

 Tracker
Global Chemicals Tracker

The Global Chemicals Tracker (GChT) provides asset-level data on global chemical plants, covering capacity, operating statuses, feedstocks, and owners...

Open Tracker

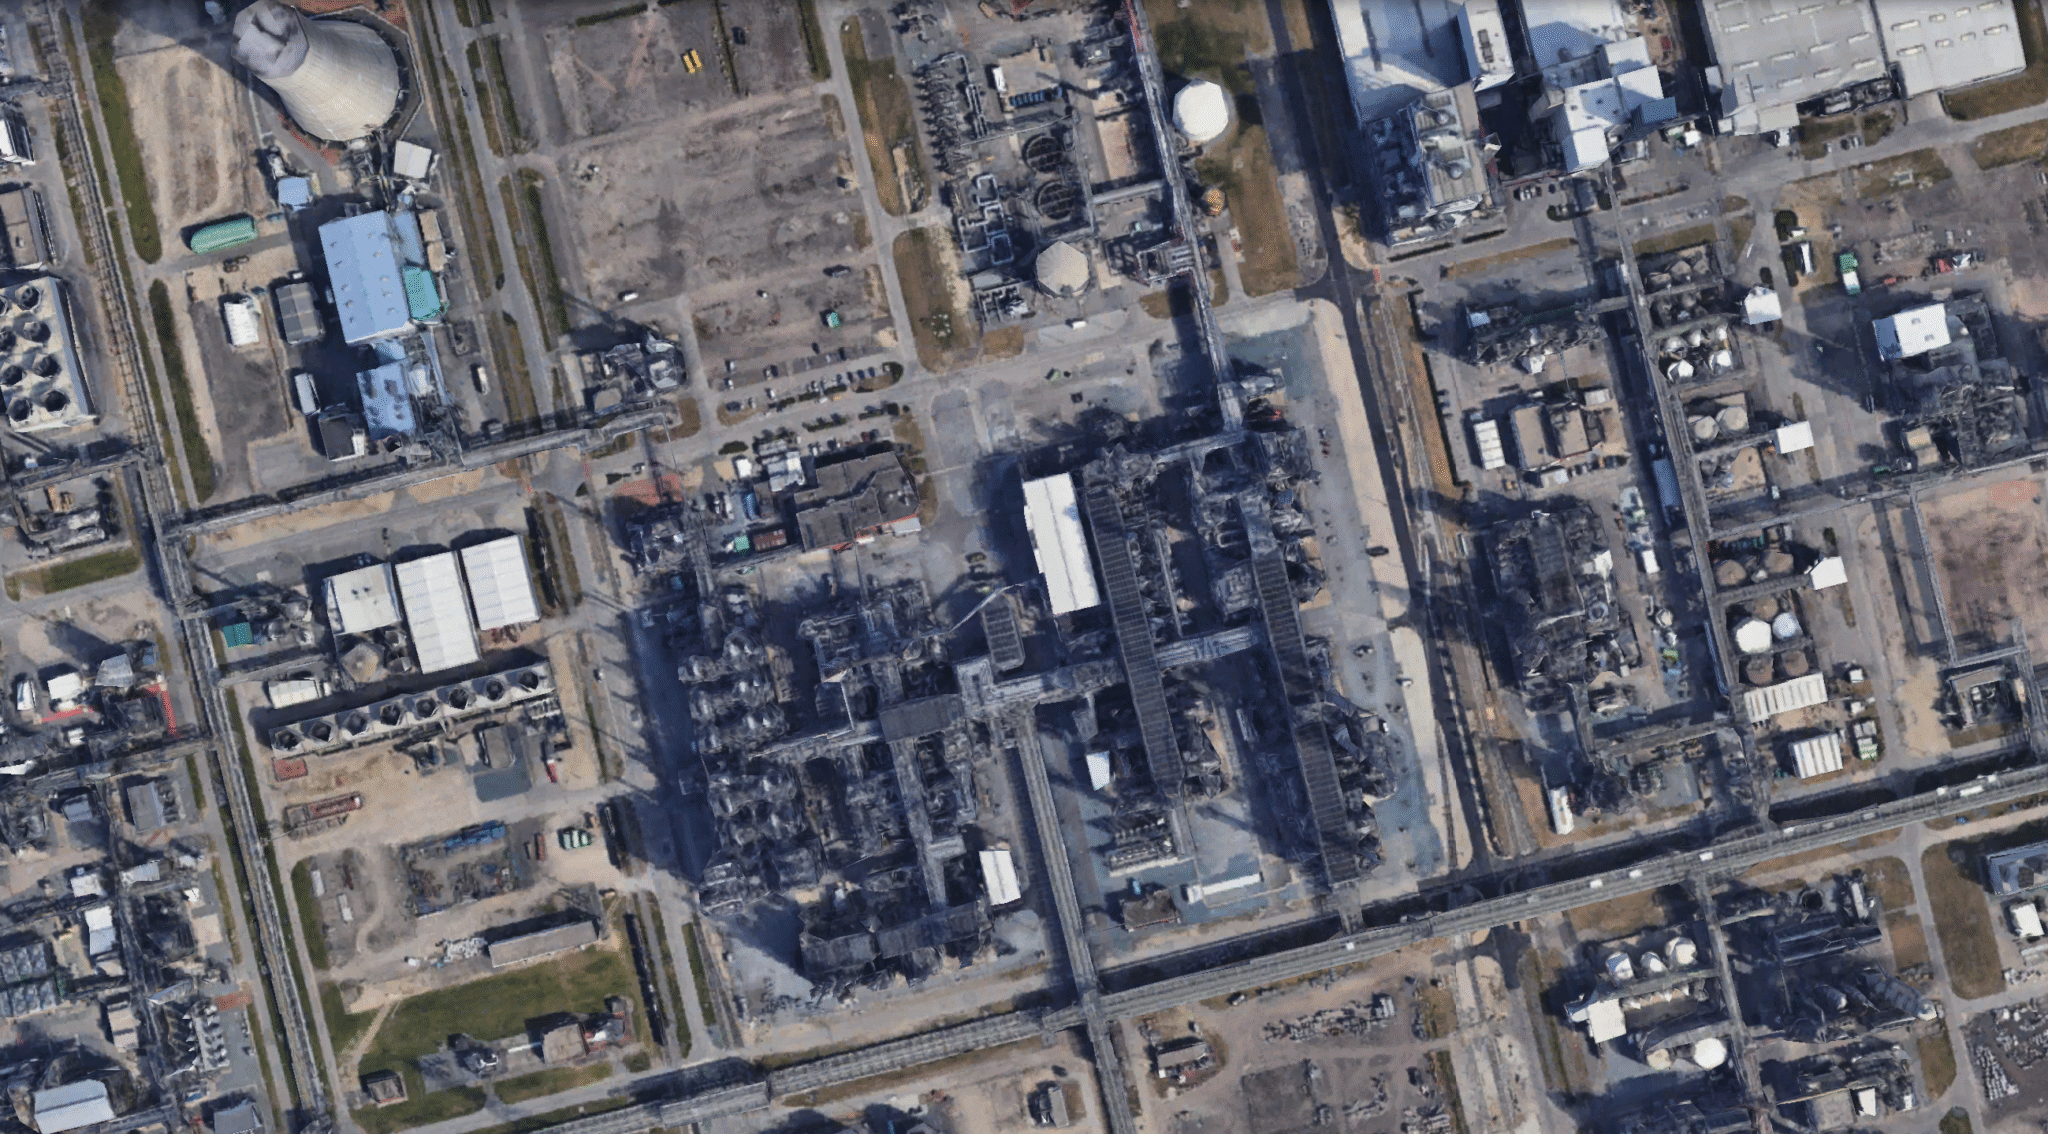
BASF Antwerp Verbund Chemical Complex, Antwerp, Belgium Map Data: Google, Image ©2025 Airbus, CNES/Airbus, Landsat/Copernicus, Maxar Technologies

Subscribe to stay informed about our latest work and updates

Join our mailing list

Footer

Browse data
Oil and gas Coal Renewables and other power Heavy industry Finance and corporates Energy transition
Insights and updates
Reports and briefings Press releases In the news Coal Wire Inside Gas
About
What is a tracker? People Financial information Careers Contact Us
© 2026 Global Energy Monitor
All Rights Reserved
440 N Barranca Ave #2878, Covina, CA 91723
Built by 89up
  