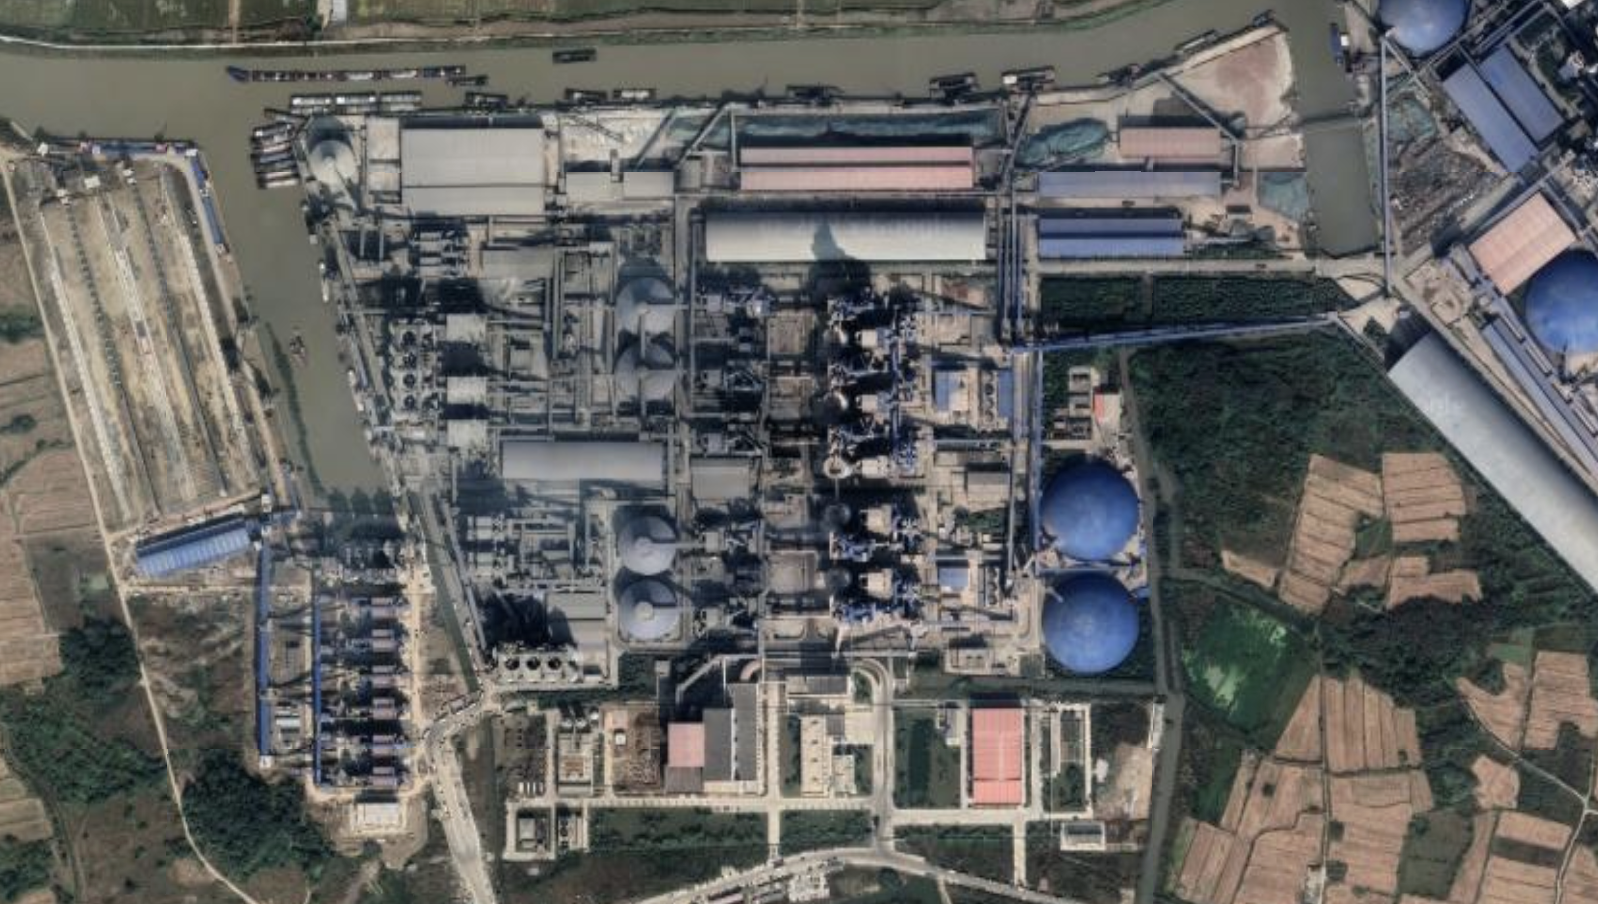
The 2026 annual release of the Global Cement and Concrete Tracker (GCCT) is live, now covering more cement and clinker production assets worldwide than before, plus new asset-level data and kiln-tracking fields.
This year’s GCCT includes:
- Expanded coverage to 3,884 plants, 369 more than last year.
- Over 6.1 billion tonnes of annual cement capacity and 3.7 billion tonnes of annual clinker capacity.
- Five new field groups: kiln counts (existing and developing), kiln technology (preheater, precalciner, waste heat recovery), alternative fuel types, clinker substitution rates, and reported 2024–2025 plant-level production.
Download the dataset
What does 2026 GCCT data show?
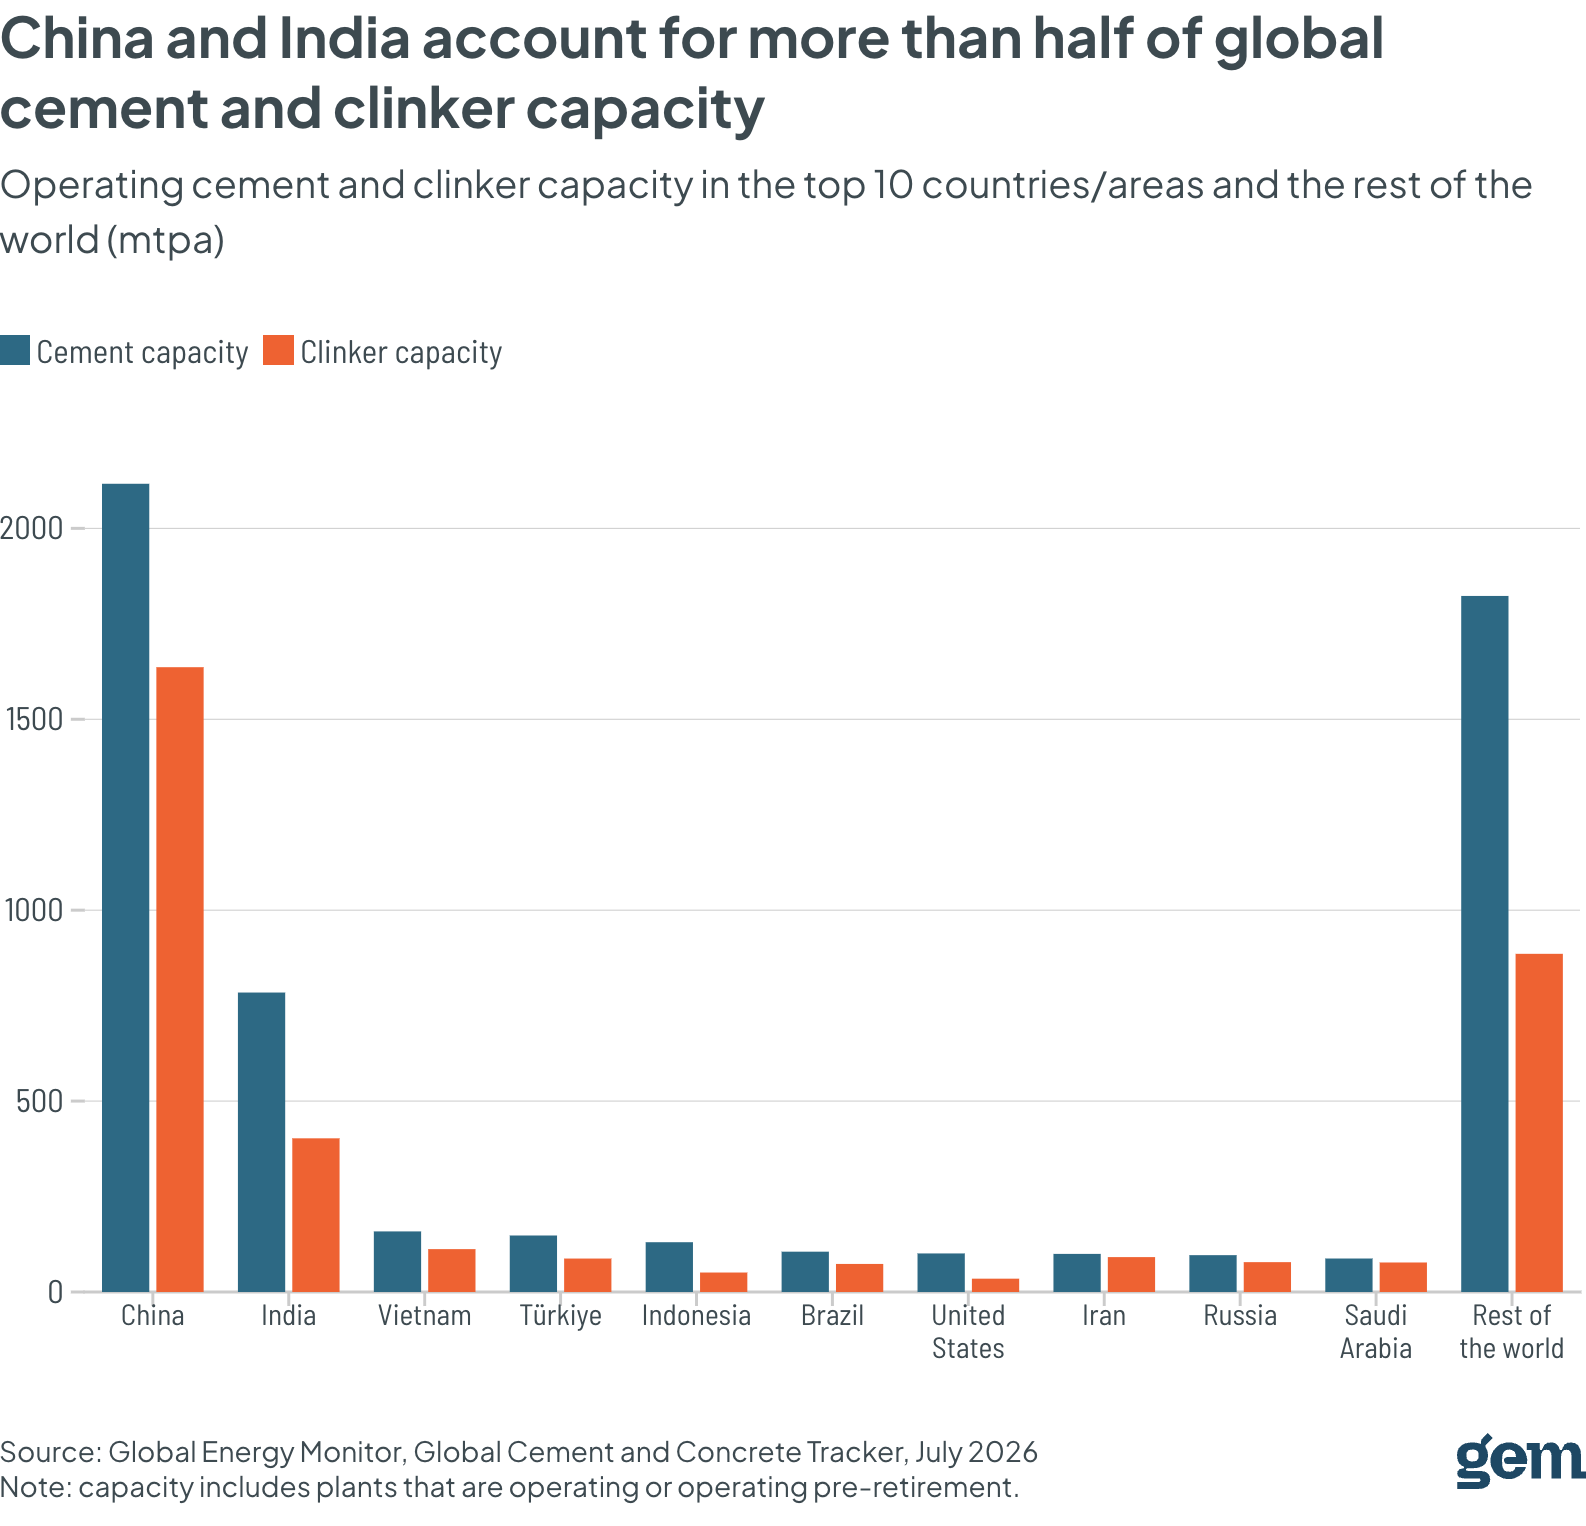
The GCCT records 5,652 mtpa of cement capacity and 3,532 mtpa of clinker capacity in operation worldwide. Production capacity is heavily concentrated: The ten largest countries account for 67% of cement capacity and 76% of clinker capacity.
China and India sit far ahead of the rest, with a combined 50.6% of global cement and 57.6% of clinker capacity. China alone operates 2,116.8 mtpa (37.5%) of global cement capacity and 1,636.9 mtpa (46.4%) of global clinker. India follows with 784.3 mtpa (13.9%) of cement capacity, and 402.5 mtpa (11.4%) of global clinker.
Though China leads in operating capacity by a wide margin, its expansion has effectively stopped, with no new plants entering operation since 2025 and a pipeline of just 2.2 mtpa clinker capacity; instead, 27.5 mtpa cement capacity was retired over the past year, the most of any country. India, on the other hand, added 26.9 mtpa since the start of 2025 and has the most capacity under development with 58.3 mtpa, of which 23.9 mtpa is already under construction.
New this year: Kiln-level data at every plant
Cement accounts for roughly 8% of global CO2 emissions, and most of that comes from clinker production in the kiln. The GCCT now includes kiln-level data at each plant to shed light on those emissions. These new data reveal how many kilns each plant runs, how old they are, what technology they use, and what they burn.
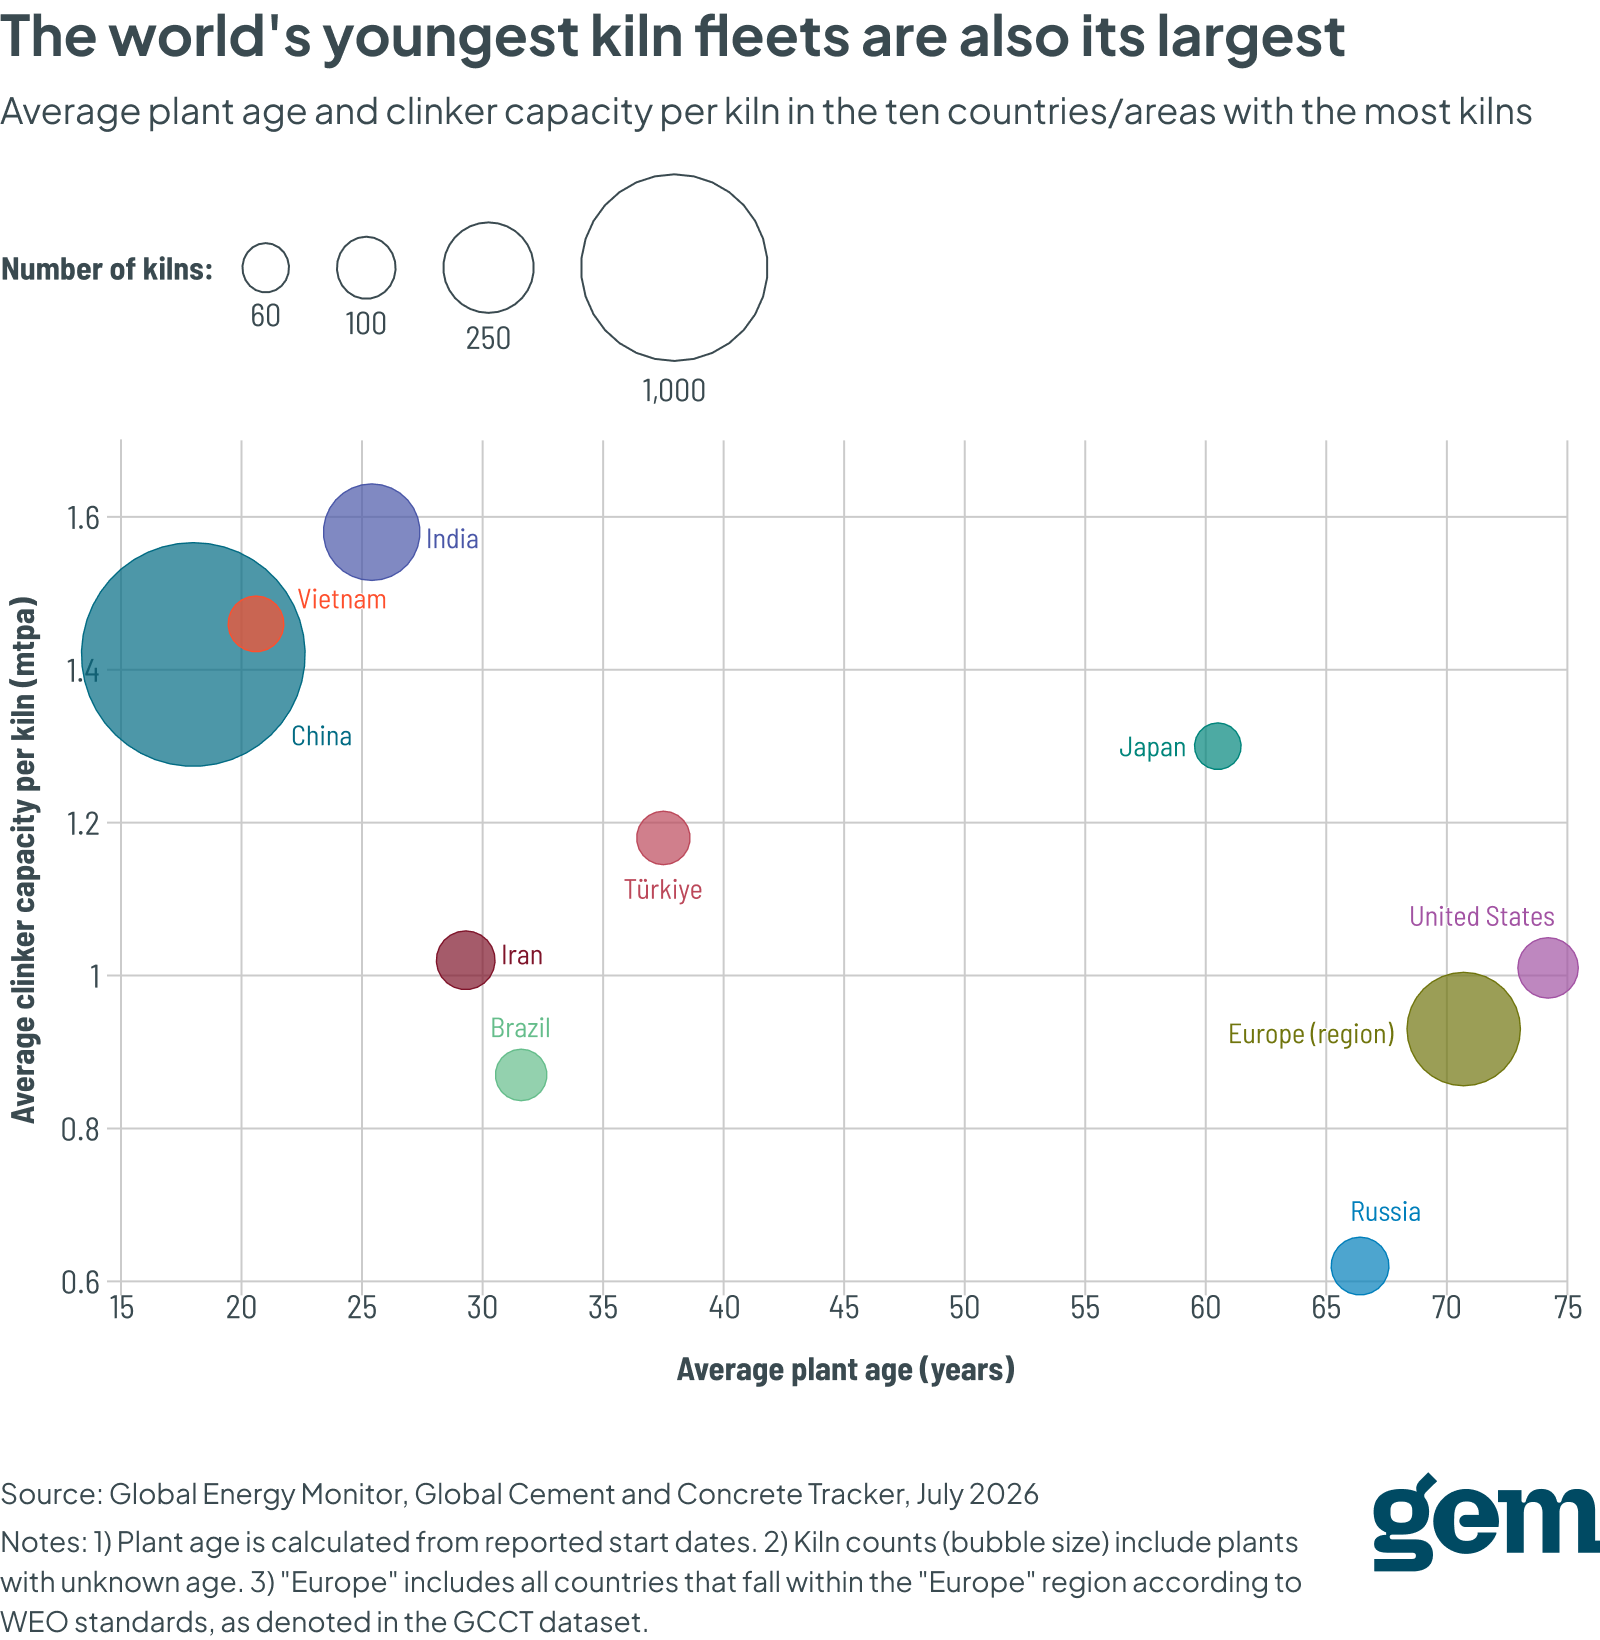
Cement kilns typically operate for 40 years or more, so the current age structure of the fleet largely determines emissions through 2050. Operating plants in China average just 18 years old, meaning most of the country's 1,501 kilns can run into the 2050s and beyond without reaching the end of their technical lifetime. In the United States and Europe, where plants average over 70 years old, a larger share of capacity will face retirement or major reinvestment decisions within the next decade. The 209.2 mtpa cement capacity now under development, concentrated in India and Africa, would add another generation of long-lived assets if built.
How is cement decarbonization progressing?
The GCCT tracks five main decarbonization technologies in the cement industry: clinker substitution, alternative fuel use, clay calcination, carbon capture, utilization and/or storage, and waste heat recovery. Among the most effective of these is the reduction of clinker use in cement. Across all GCCT plants that produce cement, just 14.3% of plants substitute more than 5% of clinker with supplementary cementitious materials, and just 0.2% substitute more than half.
Alternative fuel use offers another decarbonization signal and also shows room for growth. Of all plants with kilns, 27.8% burn alternative fuels alongside or instead of coal and petcoke, most commonly refuse derived fuel, industrial waste, and biofuels.
Carbon capture, utilization and/or storage (CCS/CCUS) technology has yet to be proven at scale in any industry. The GCCT tracks 87 plants with CCS projects that are operational or under development, representing just 3.1% of all plants with kilns. Existing CCS/CCUS projects capture only a fraction of a plant's emissions.
The most common decarbonization technology, waste heat recovery, is implemented at 33.6% of plants. Though relatively well-established, waste heat recovery does not cut process emissions but rather reduces energy use, meaning the decarbonization potential is limited. The least common technology is clay calcination, and is found at just 1.2% of plants.
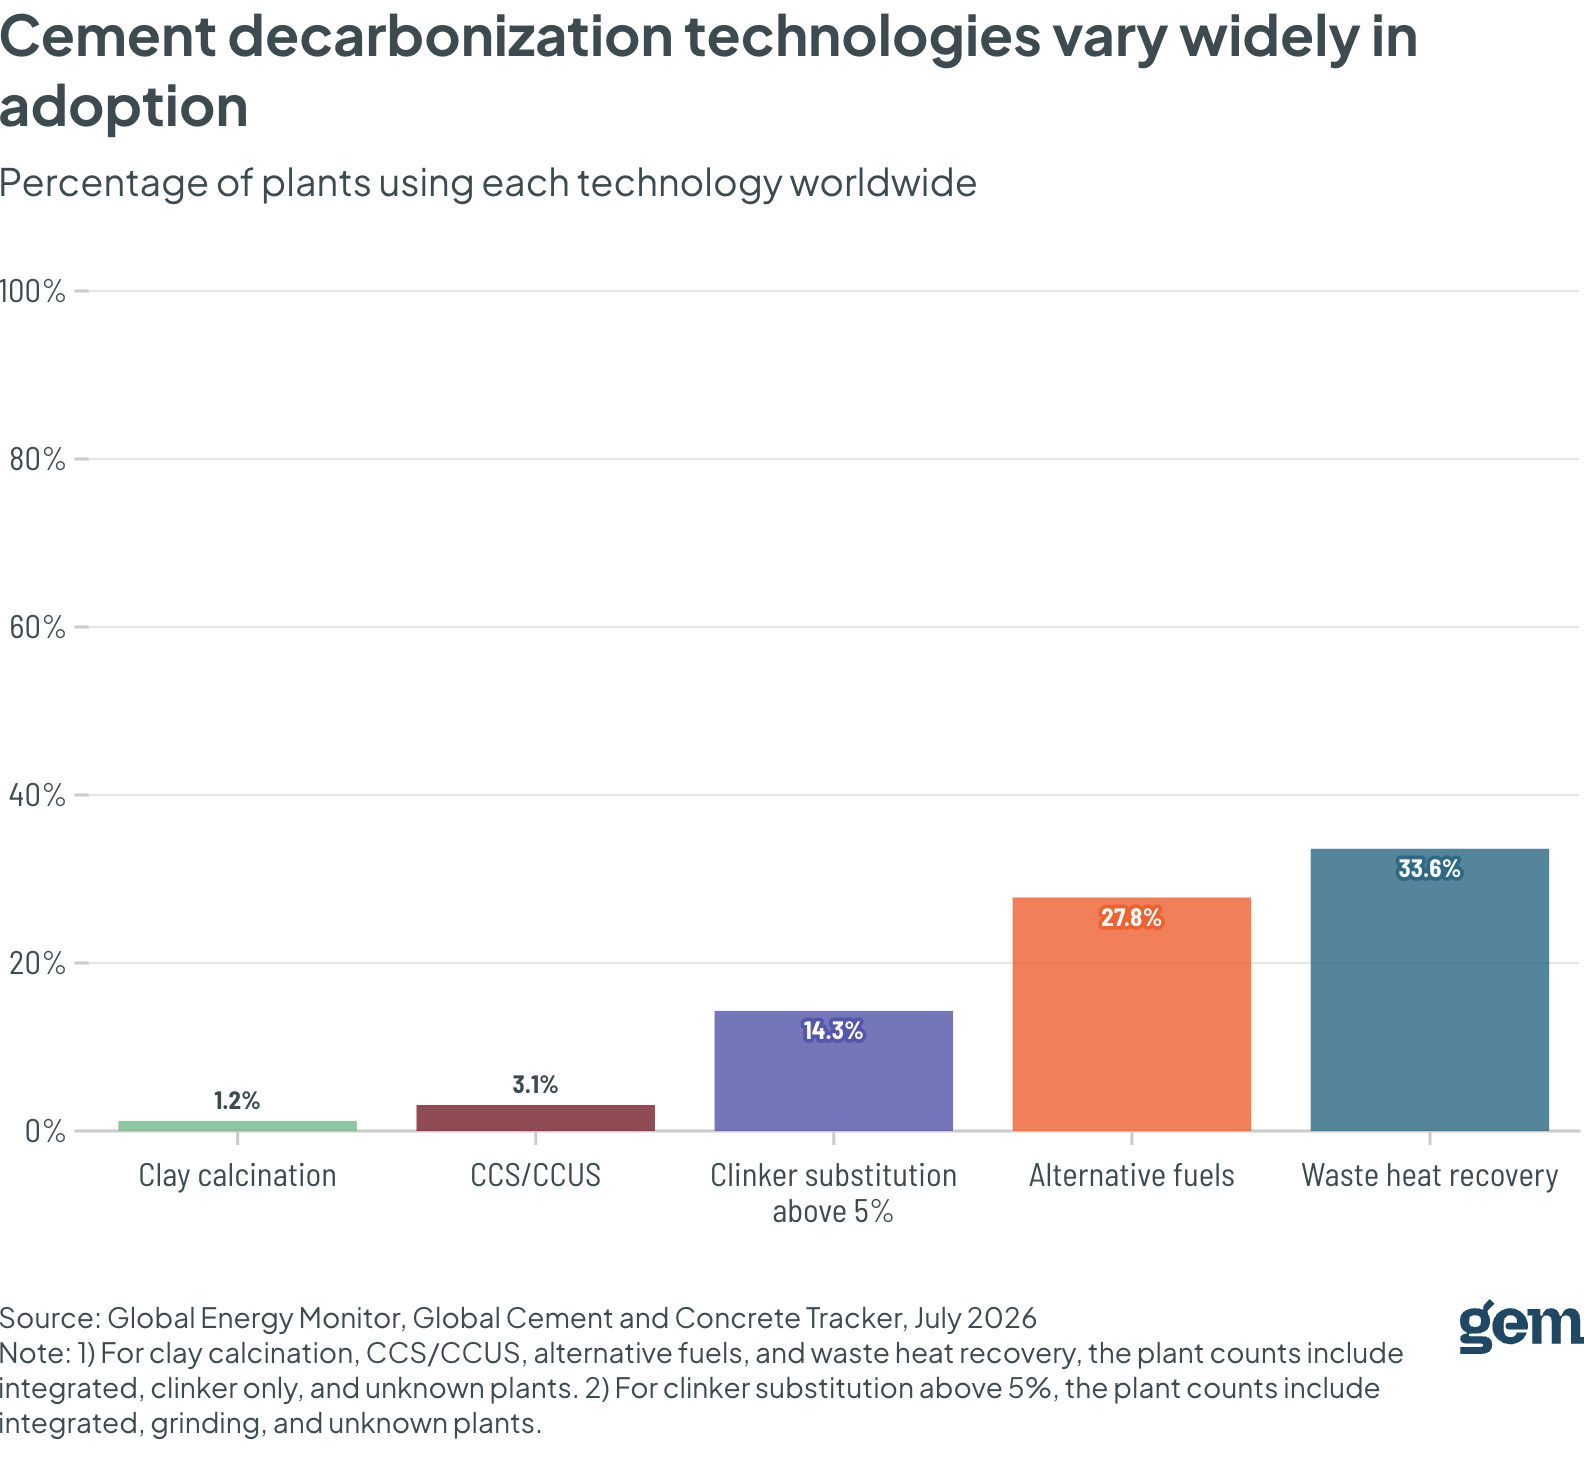
While energy efficiency has spread across a third of the fleet, the measures that most reduce emissions, higher clinker substitution and alternative fuels, have more room to grow.
Together, these findings show where cement decarbonization stands today and how much further there is to go. The GCCT will continue to track that progress as it unfolds.